project 3
Mitigating uncertainty with topology
I envision new methodologies to quantify, visualize, and mitigate data uncertainties by combining topological, geometric, statistical, and visualization techniques. Uncertainty visualization is a very active area of research. Uncertainty information is often summarized via statistical quantities (such as mean, median, and standard deviation) and encoded with data via color, opacity, texture, glyphs, animation, etc. The challenges associated with the study of structure-wise uncertainty in graph-based descriptors can be attributed, in part, to the difficulty in characterizing and quantifying their structural uncertainty. In particular, ensemble datasets combining multiple realizations of a phenomenon are often used to mitigate the effects of uncertainty.
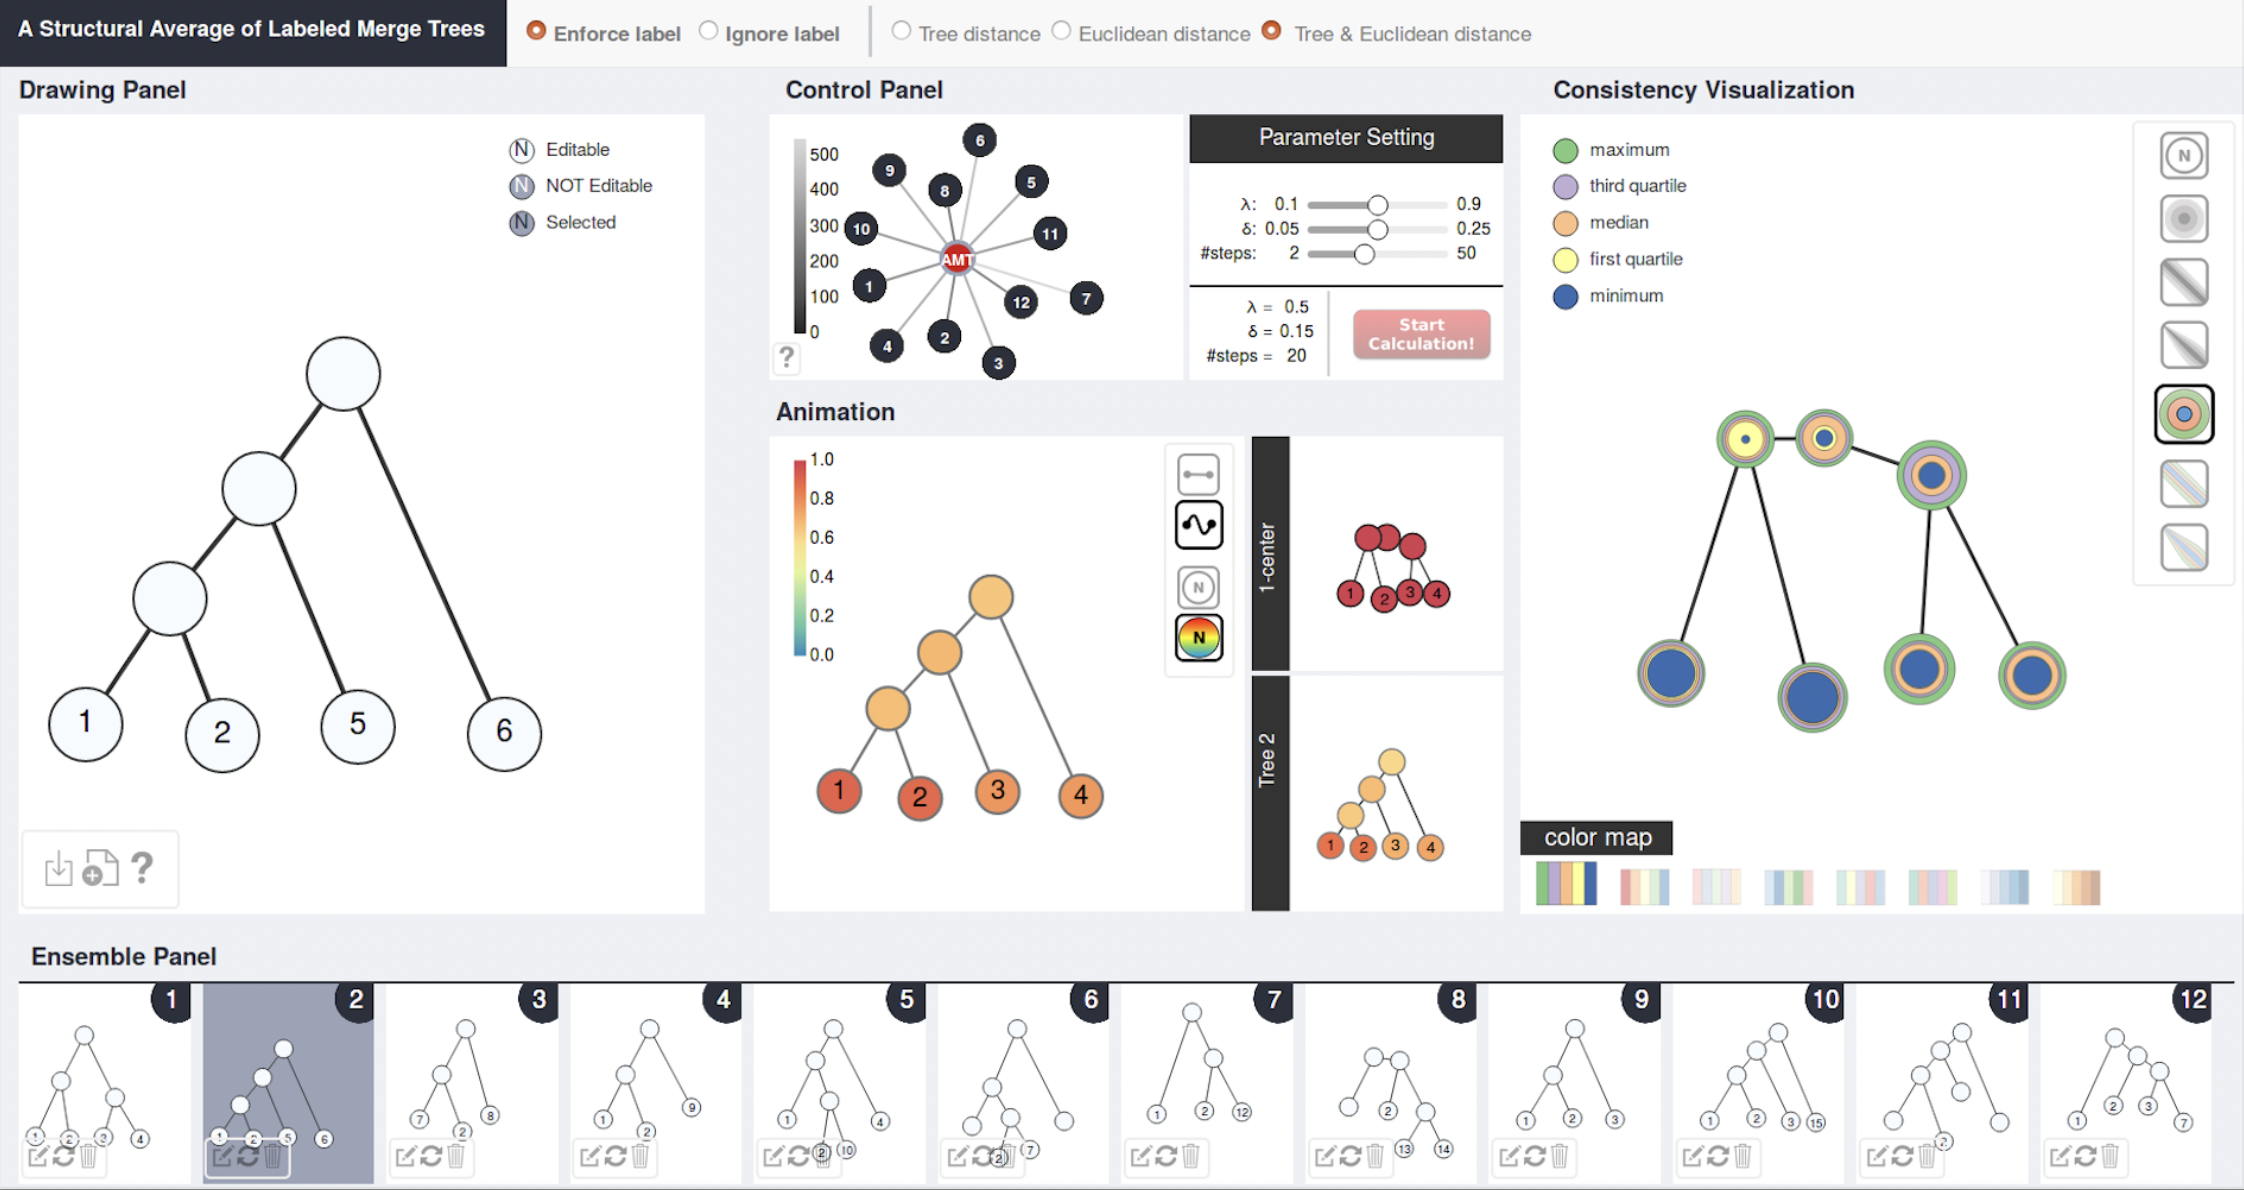
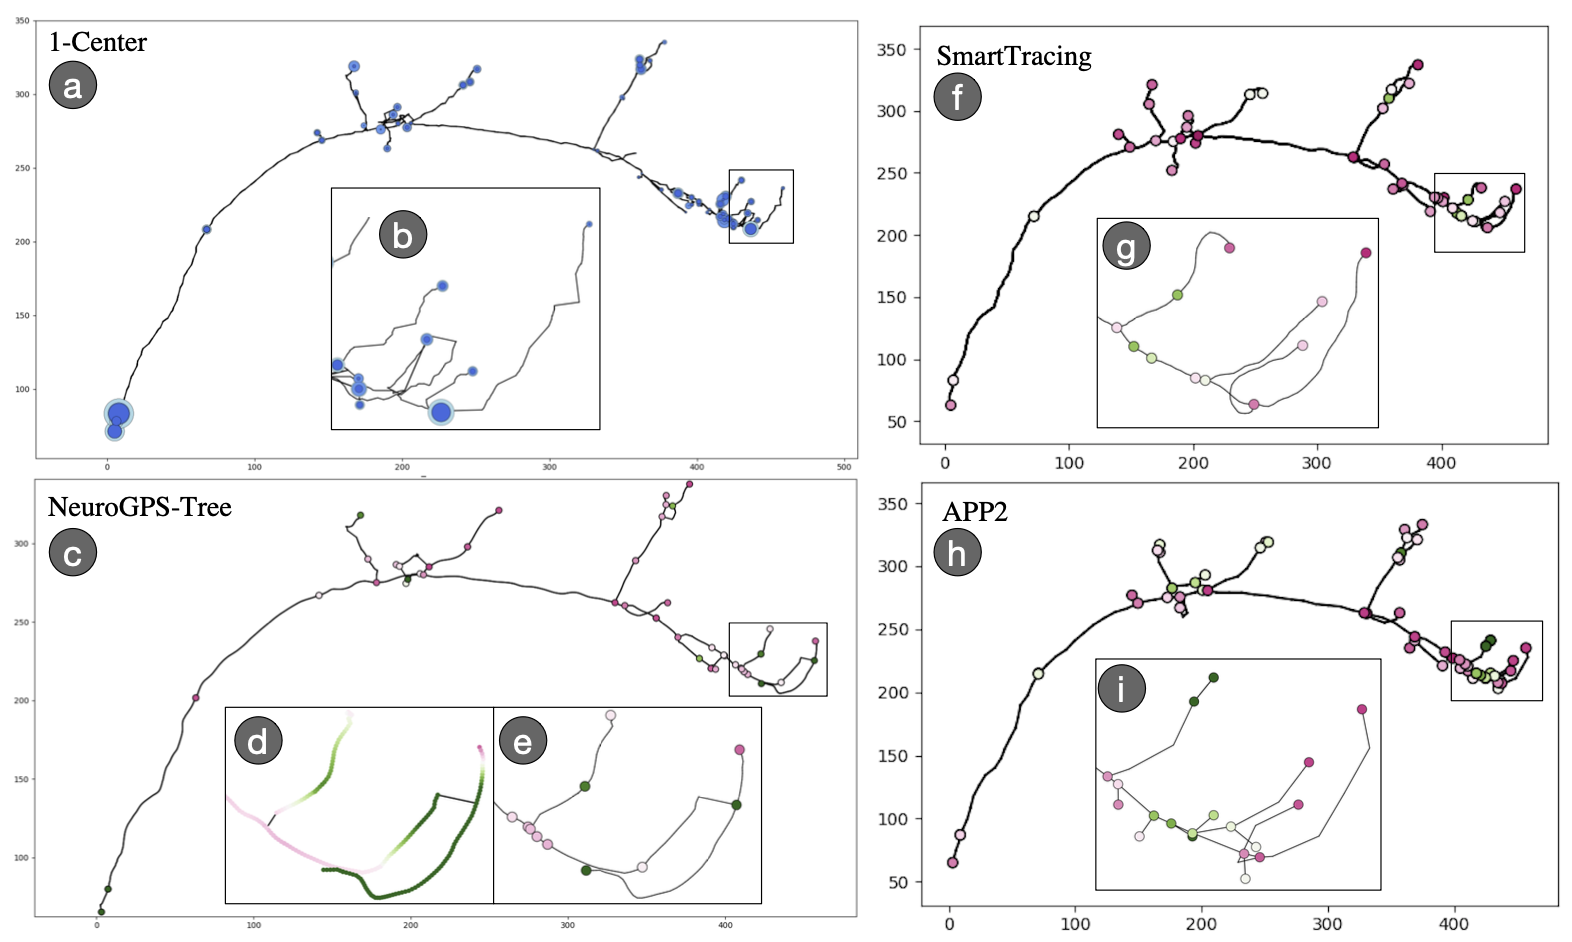
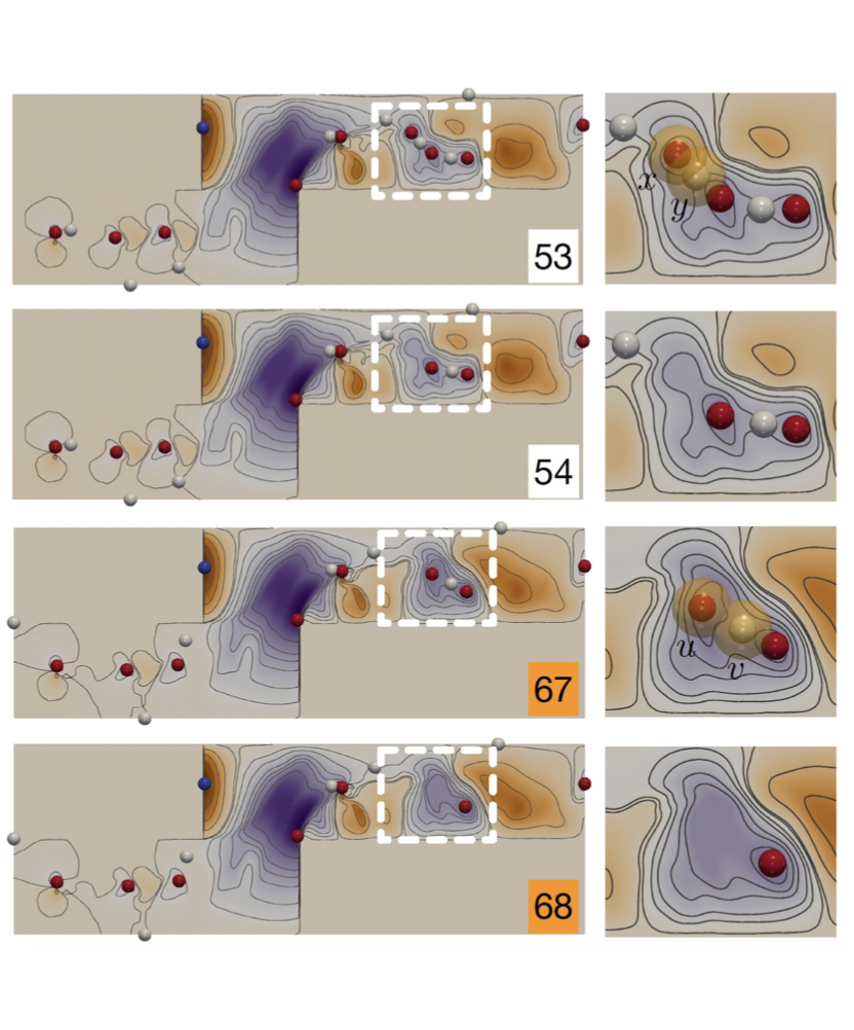
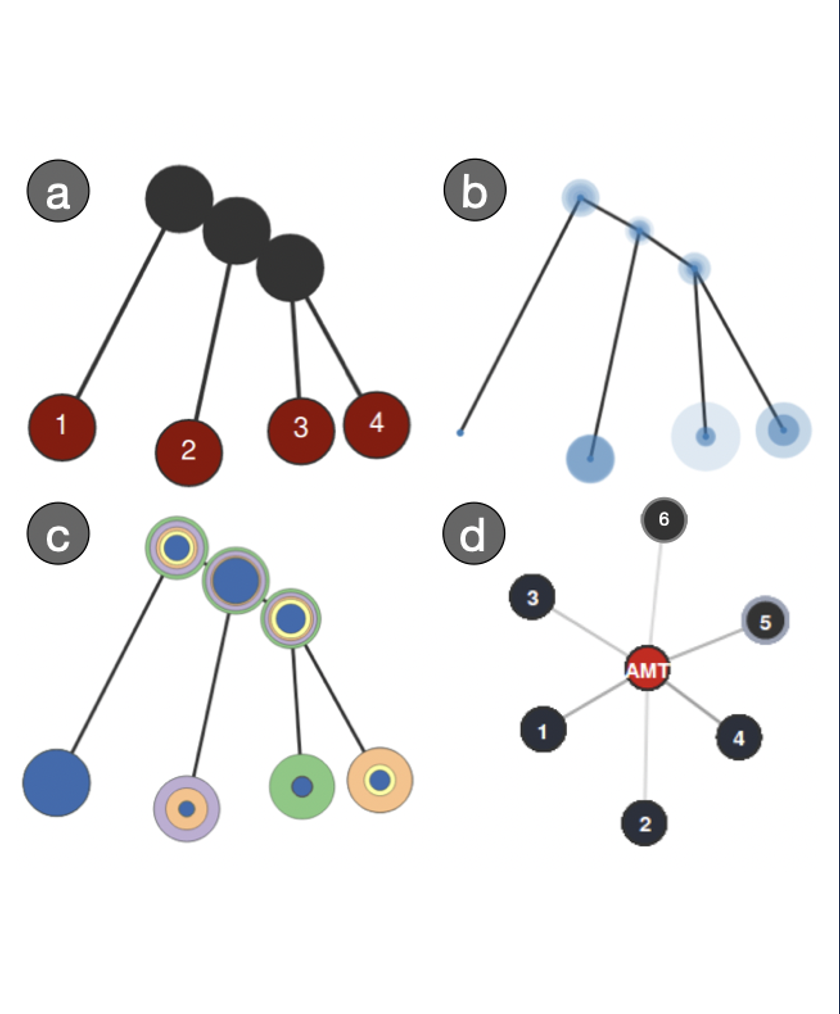
We designed and led the development of an interactive visualization system resembling a numerical calculator that takes a set of merge trees as input and outputs a tree as their structural average [VIS19]. This visualization tool can highlight structural similarities between the input and the average and incorporate uncertainty information for visual exploration. Our proposed uncertainty visualization measure can be used to understand structural variations among merge trees arising from scalar field ensembles. For example, I used these proposed methodologies to help study differences/variations among different reconstructions of the same neuron cell.
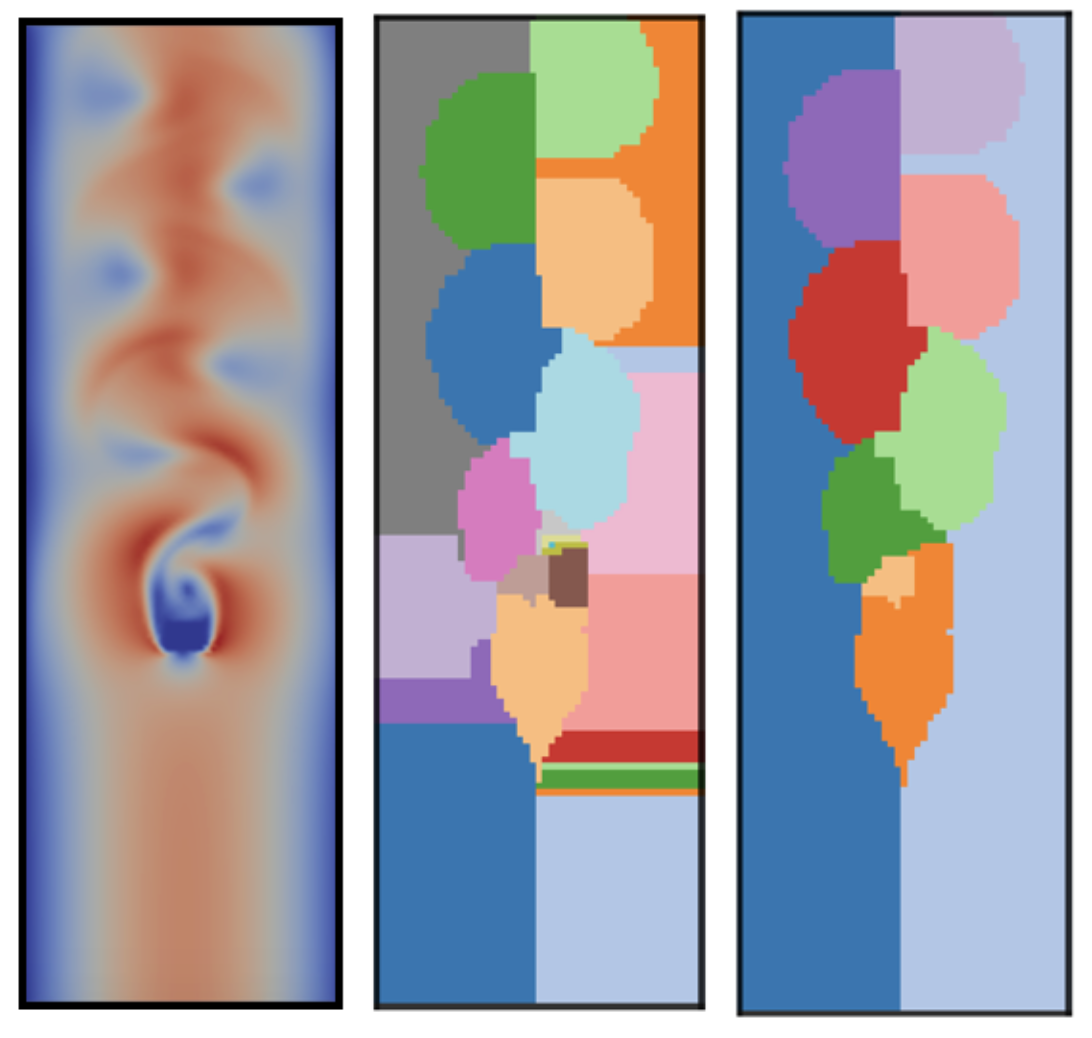
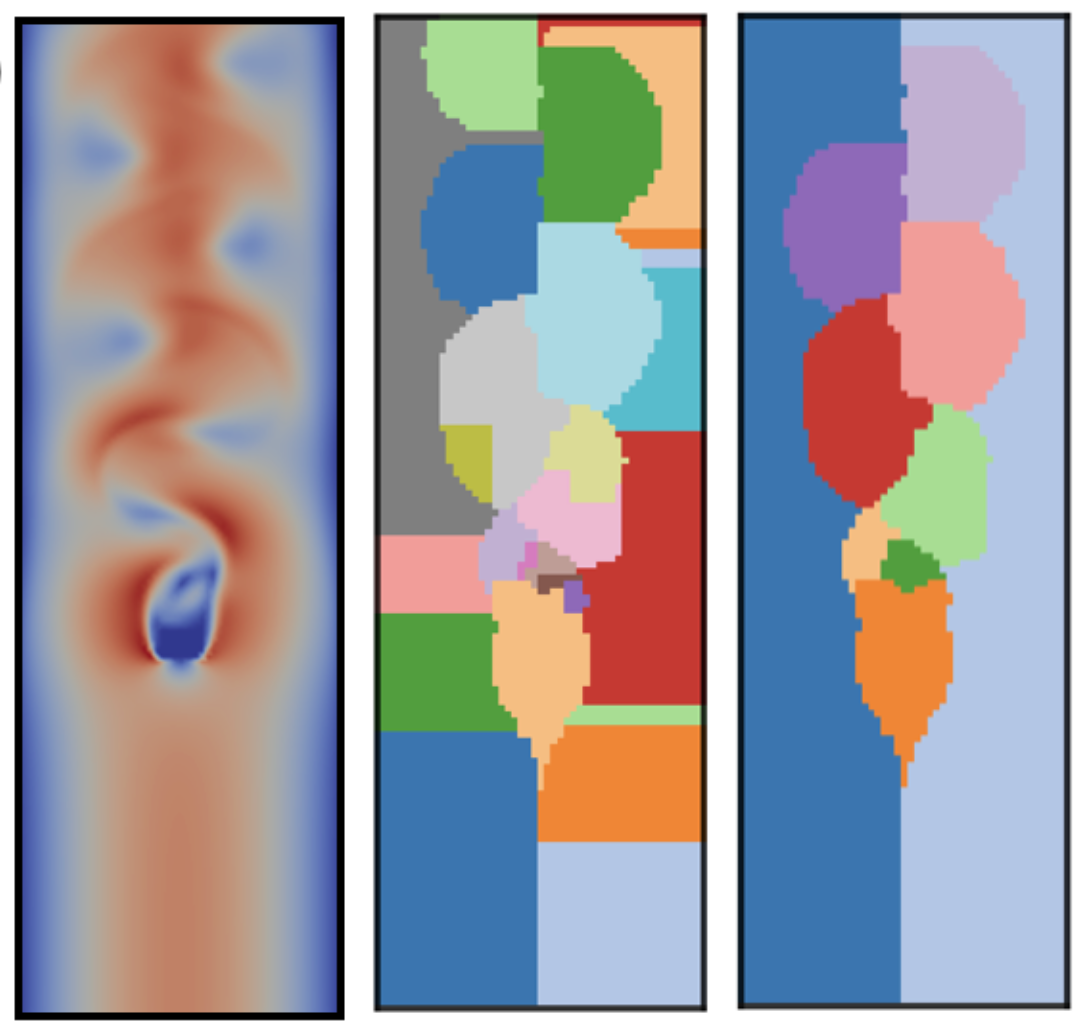
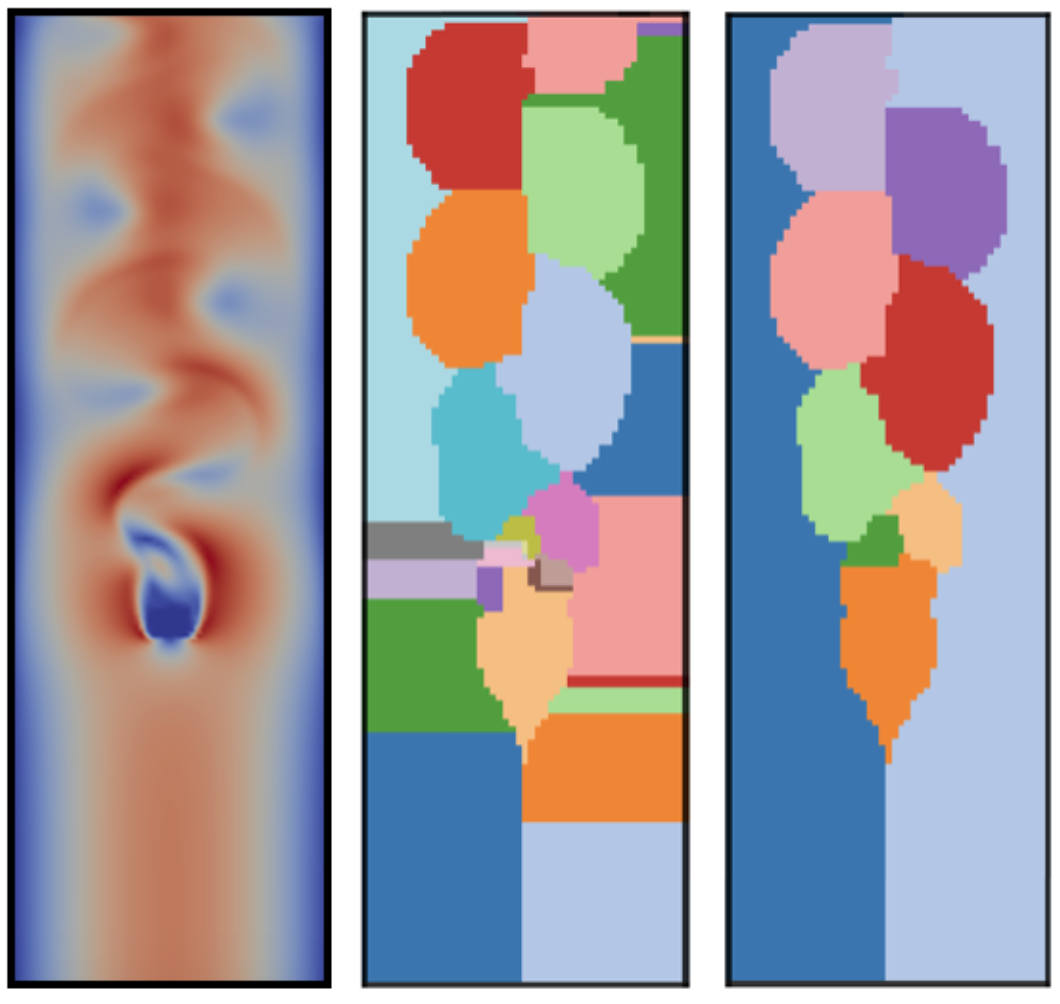
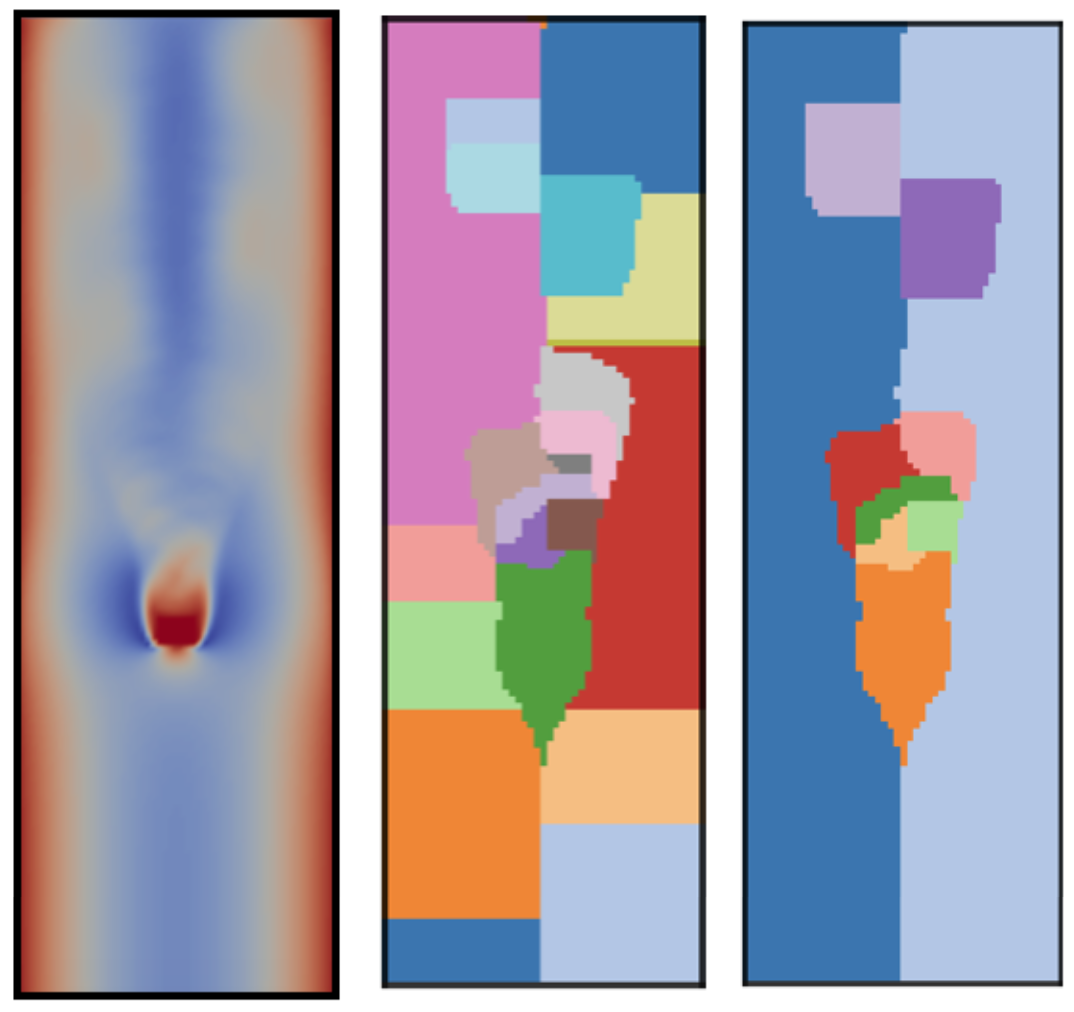
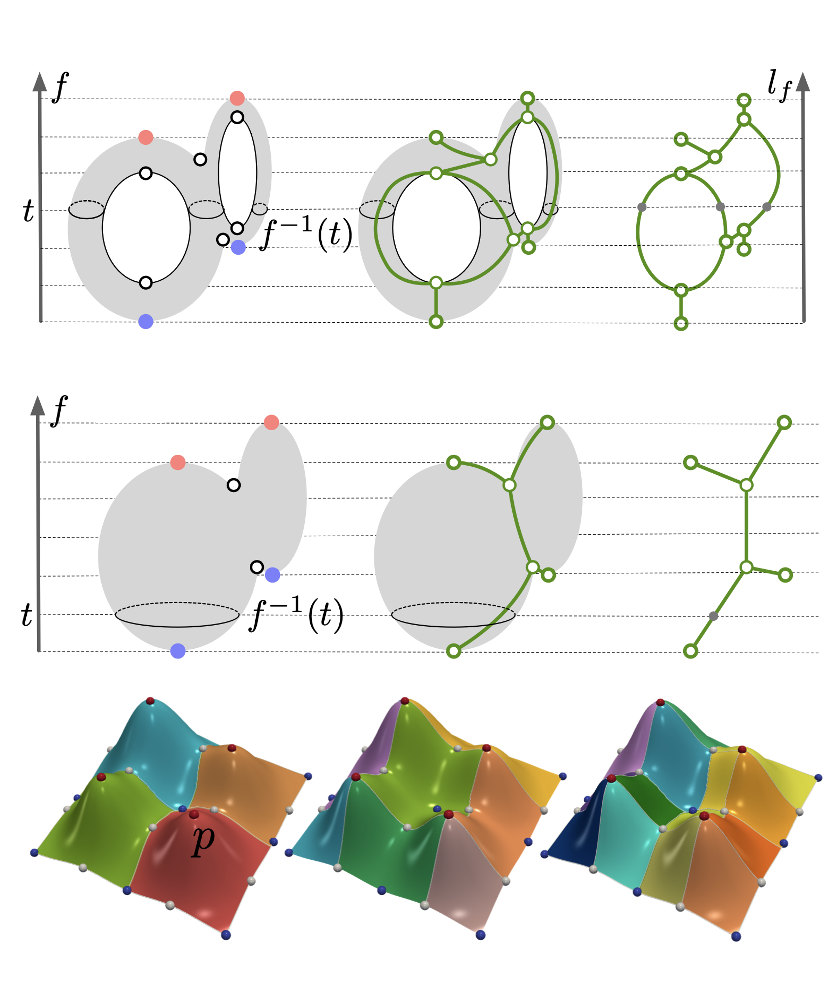
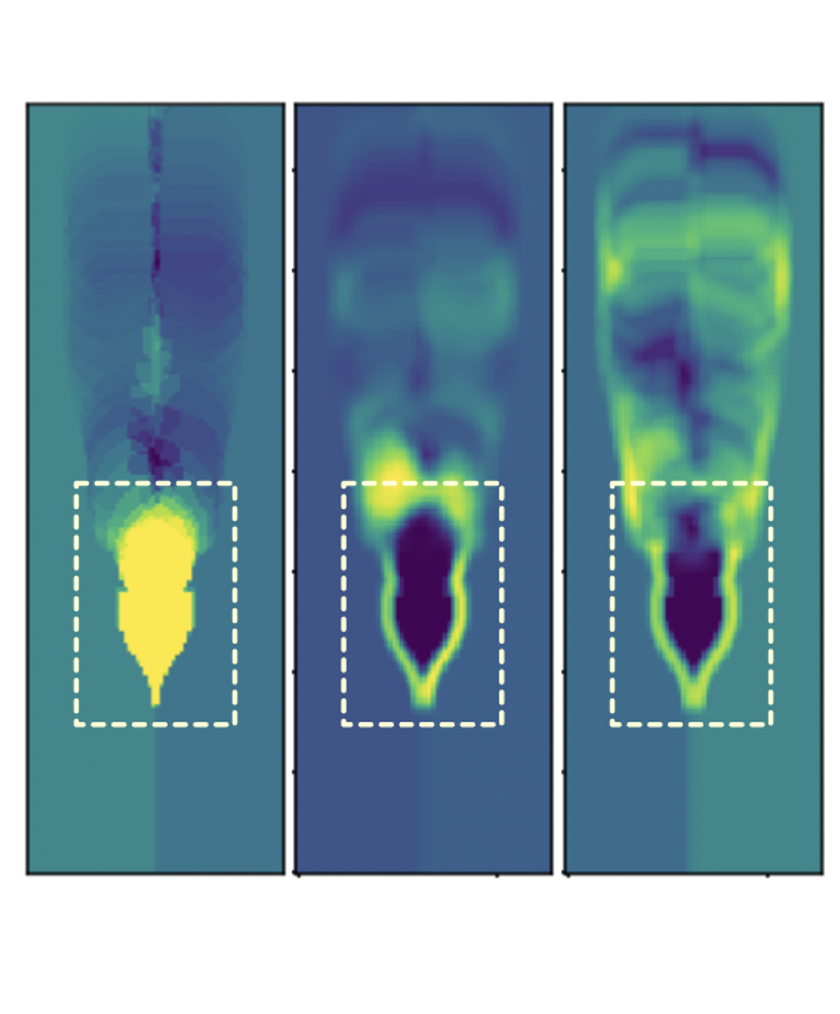
Another example is statistical summary maps for quantifying structural variations and visualizing positional uncertainties of Morse complexes in ensembles [TVCG20]. Specifically, we introduced three types of statistical summary maps – the probabilistic, significance, and survival maps – to characterize the uncertain behaviors of gradient flows. We demonstrated the utility of our proposed approach using wind, flow, and ocean eddy simulation datasets.
